Messy Data, Clear Vision
When the data is the story, the design better prove it.

Client
Microanalytics
What we did
Brand Discovery · Storybrand Positioning · Visual Direction · Illustration System · Lottie Animation · Scrollytelling · Webflow Development
Credits
Hoverthink
When the data is the story, the design better prove it.
Microanalytics hired us to help launch a brand new data visualization service for global executives. We delivered the strategic visual identity, visual identity direction, branded illustration and animation system. Strategic decisions led to shelving the service, but we pulled it out of the drawer, and built it properly in Webflow.

The brief
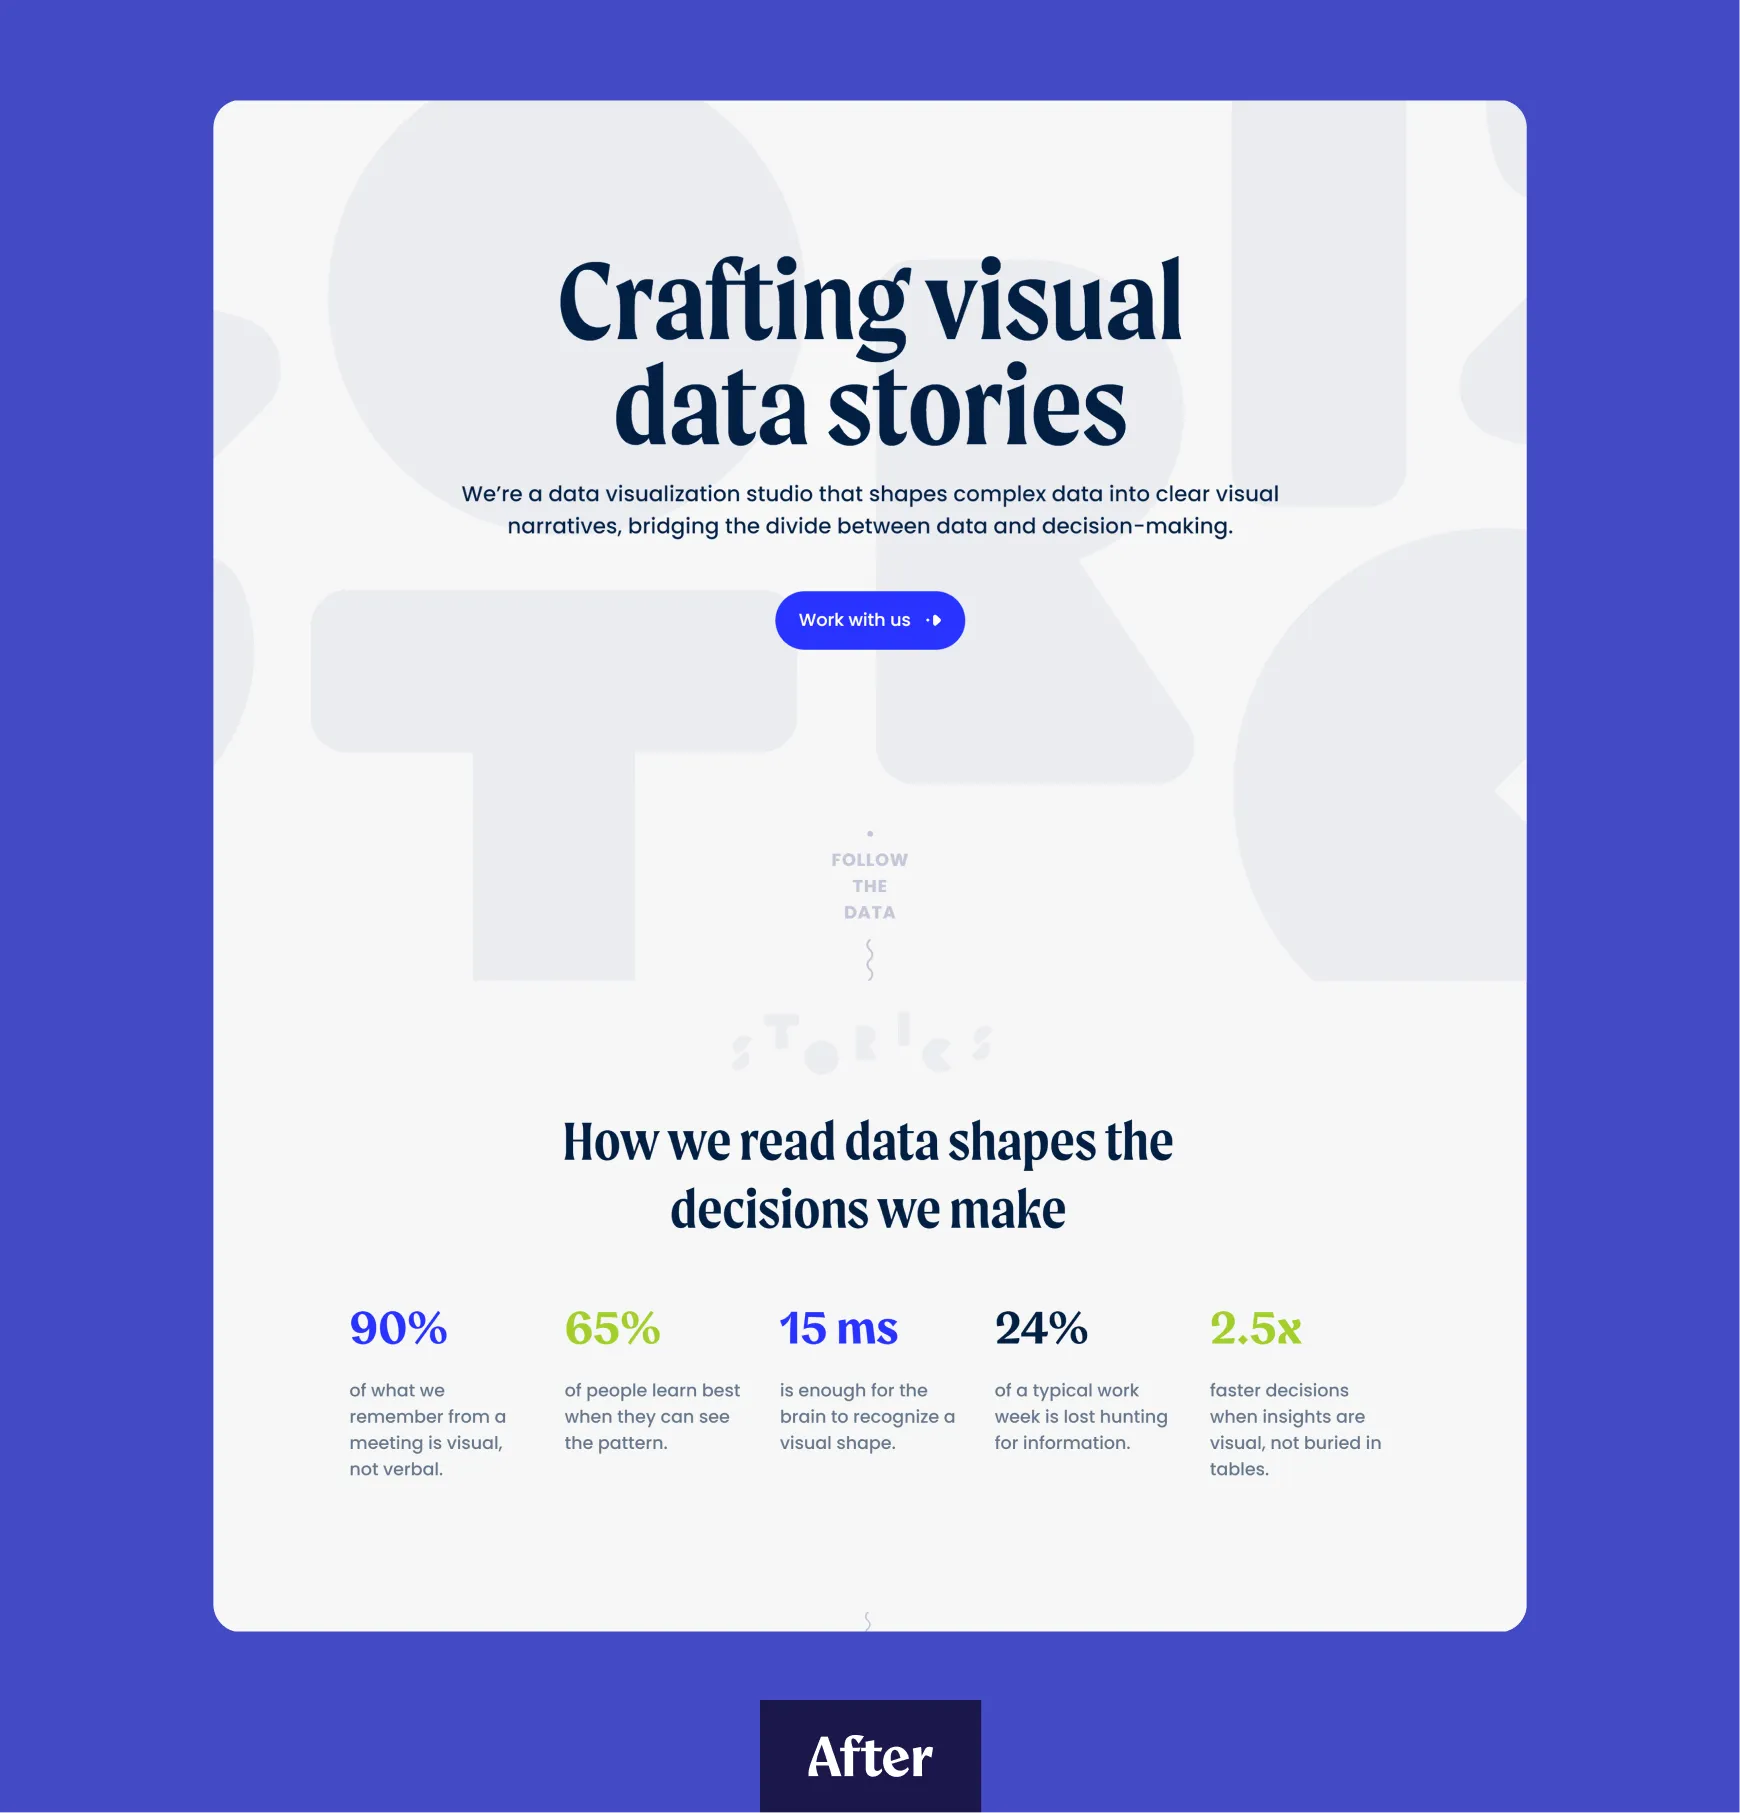
Microanalytics weren't short on credibility. Avon, ING, Leroy Merlin, Orange, Publicis, T-Mobile. They had serious clients and did serious work. But upon an audit, their website failed to rise to the same standard their company set for themselves. Their brand identity had good bones and a strong concept, however, so what initially was a new webpage brief quickly turned into a visual refresh which aimed to apply their existing identity to their website in a more thorough manner.

The visual identity
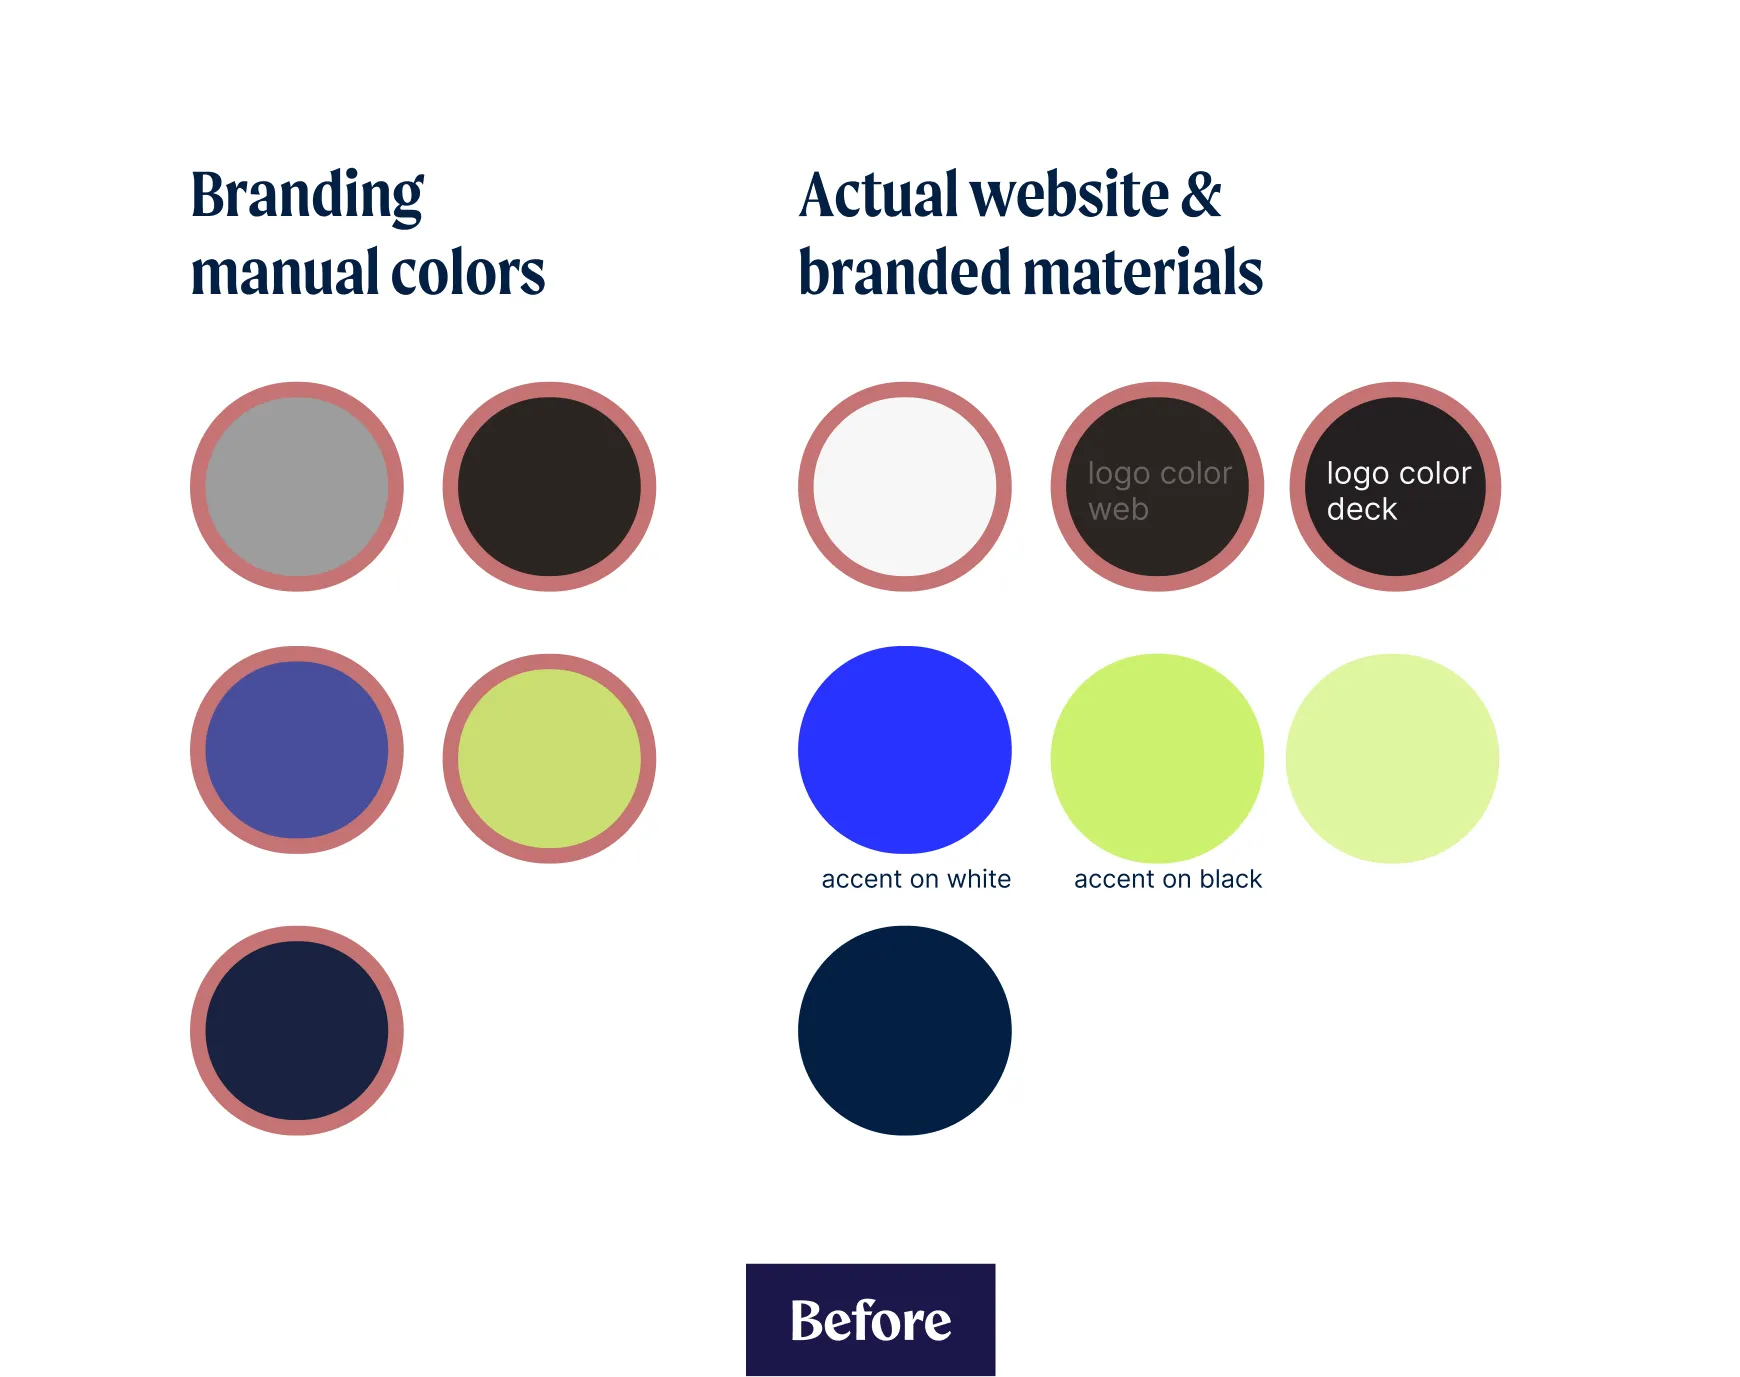
They already had a brand manual, but it was applied inconsistently. The marketing team did not use the colors provided, but adapted them in practice, which is usually a symptom that the identity doesn’t serve its purpose well. It also left too much to interpretation, and some of the visuals had no instruction on how to be reproduced.
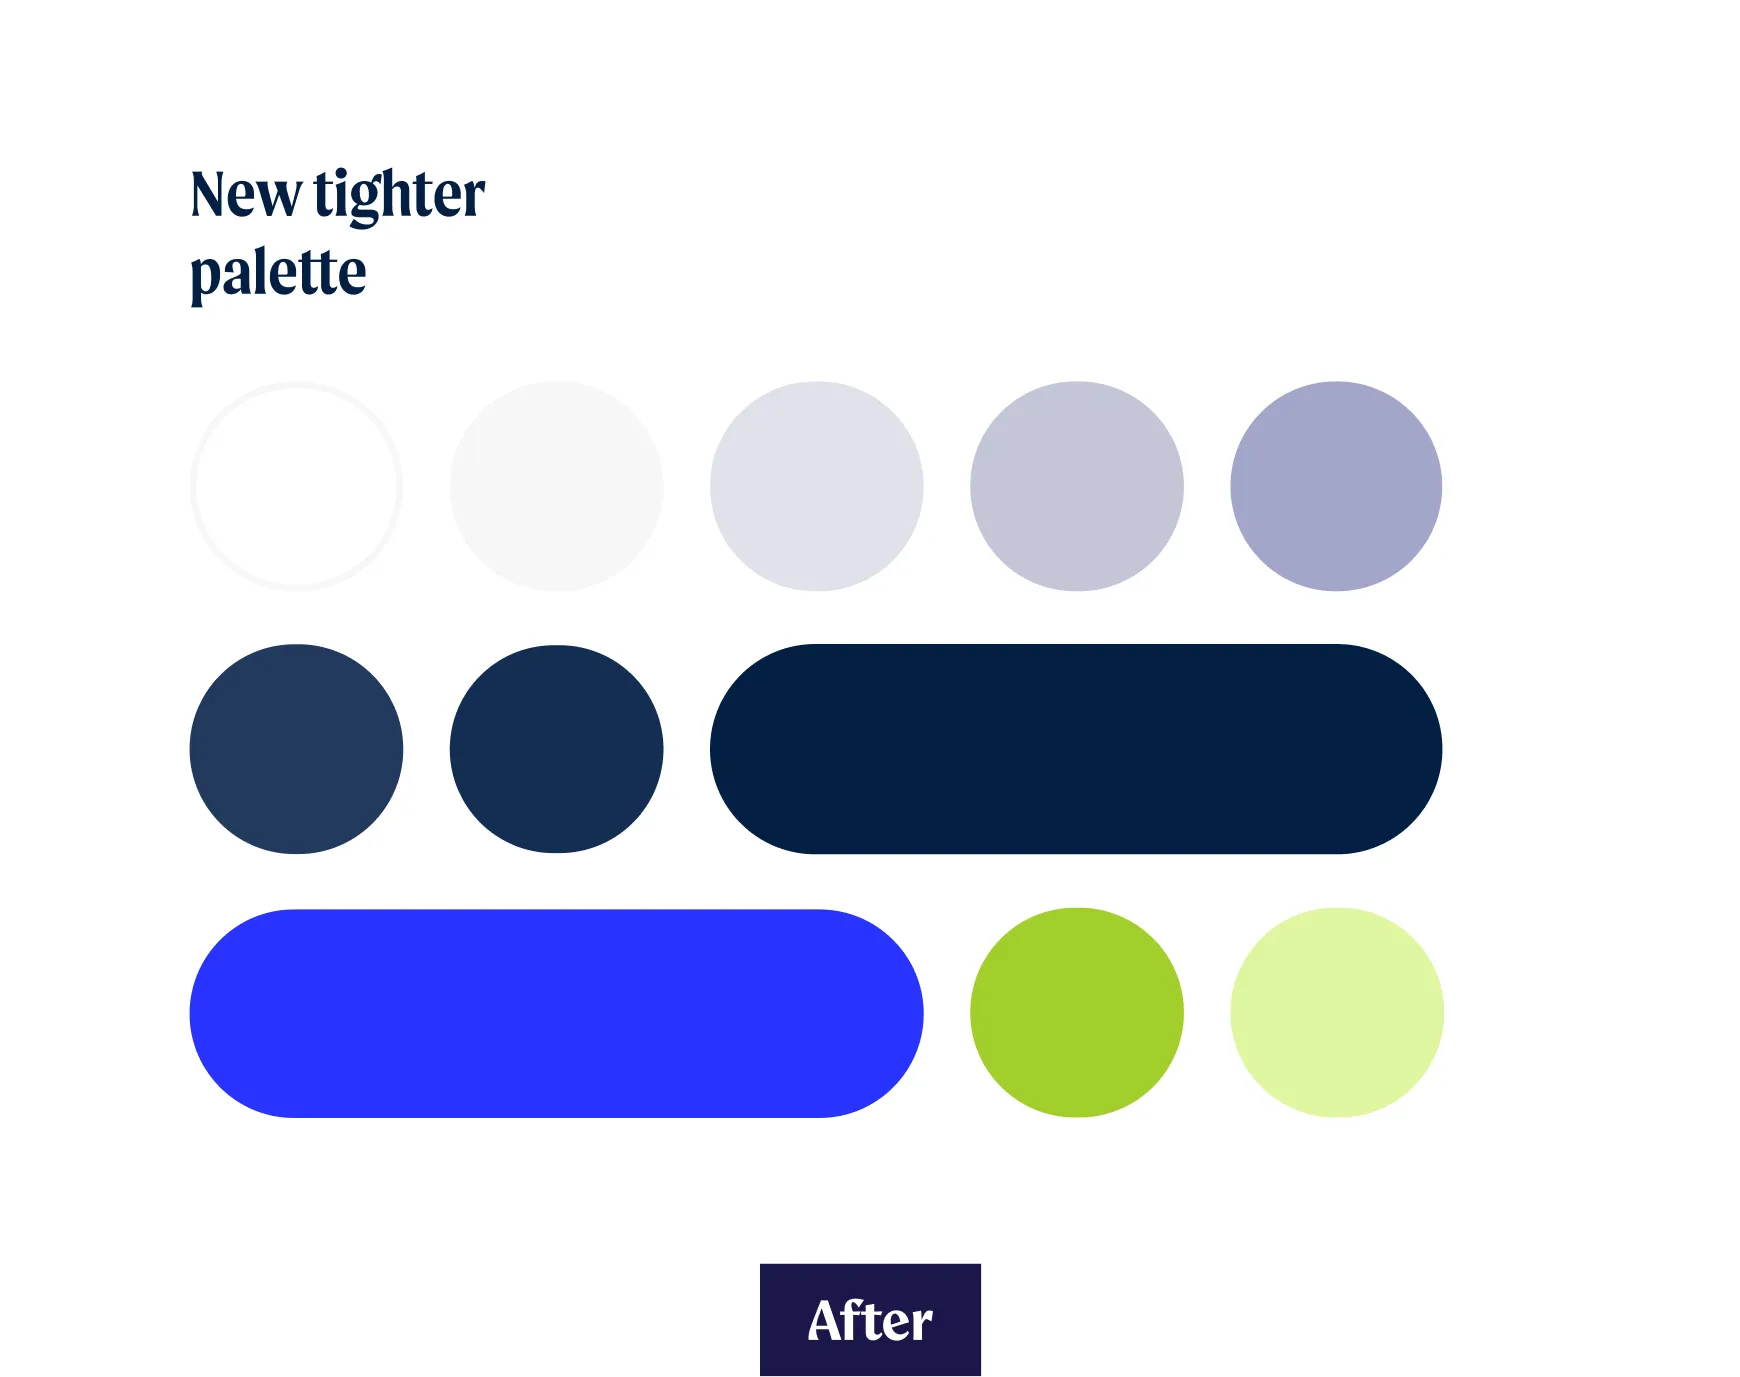
We tightened the aesthetic voice, removed unused colors to a recognizable striking minimum, and settled on an easily reproducible animation style.
Never skip the audit
Data points in a data painting
Every insight starts as a single data point. Given enough of them, and handled masterfully, they resolve into a complete picture that tells the big data story. This amazing concept was already part of Microanalytics’ ethos, so we ran with this idea and expanded it into a new visual identity.
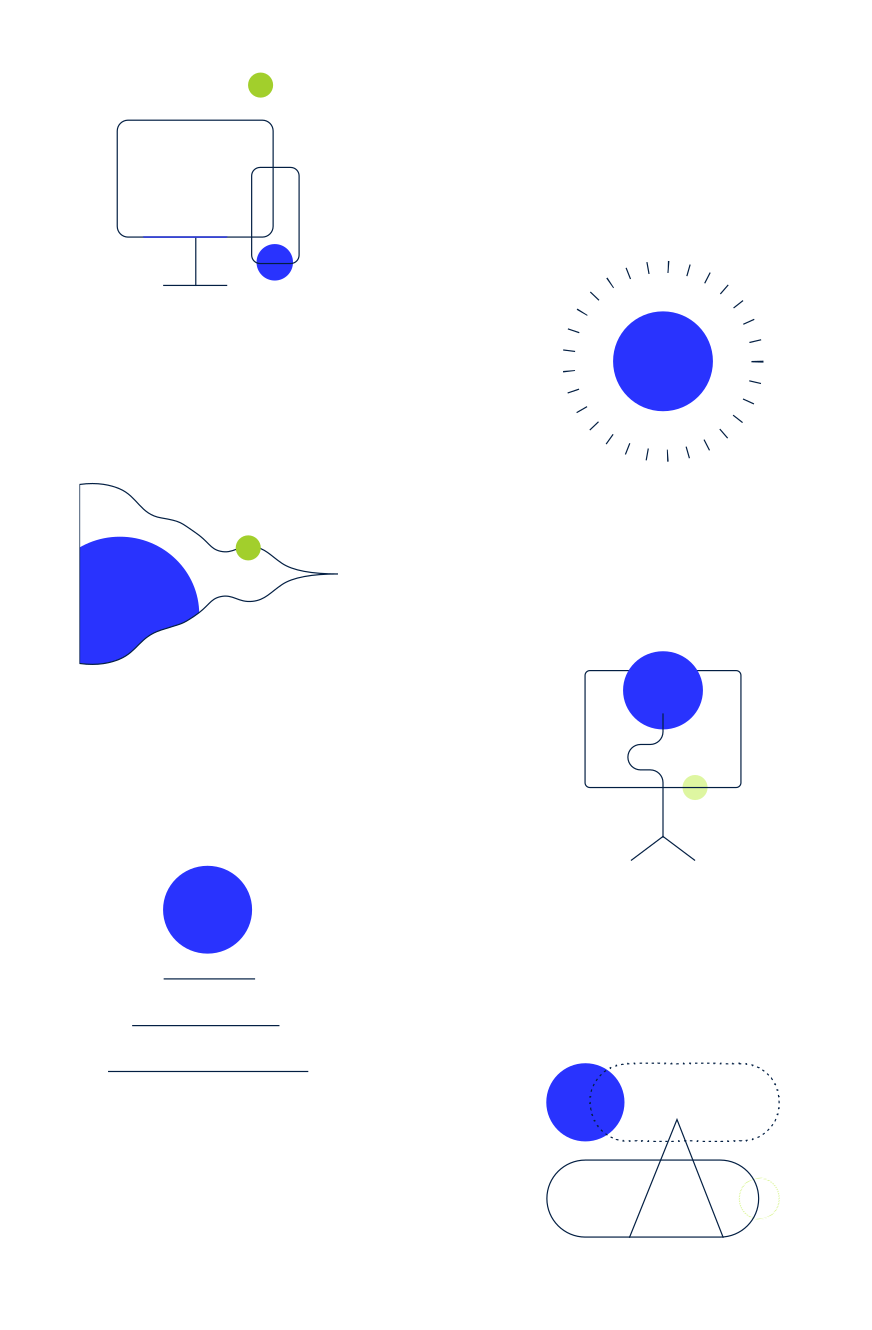
The outcome: a brand concept called Pointillism
The process of how we got there
It’s always tempting to jump right in the visual nitty gritty, that’s what we’re best at. We get an intuition of what the project could look like in the first minutes of talking, but it’s a trap. That’s why we follow the discovery process, it provides better results 100% of the time, because they’re informed by a solid strategic foundation.
What’s your story?
In the case of Microanalytics, we used Storybrand. Under this framework we set up the character (Andreea, a CMO drowning in data she can't communicate), the problem (fragmented insights that lose stakeholder buy-in), and the guide (Microanalytics, entering as the strategic partner who brings clarity).
Together with the values and personality, we built out the visual identity. Attributes like reliable, confident, nuanced, punny, analytical, humble, empathetic, intellectual, influenced our every aesthetic decision going forward.
How we did it: we started where we always start - understanding who they are before doing any visual work.
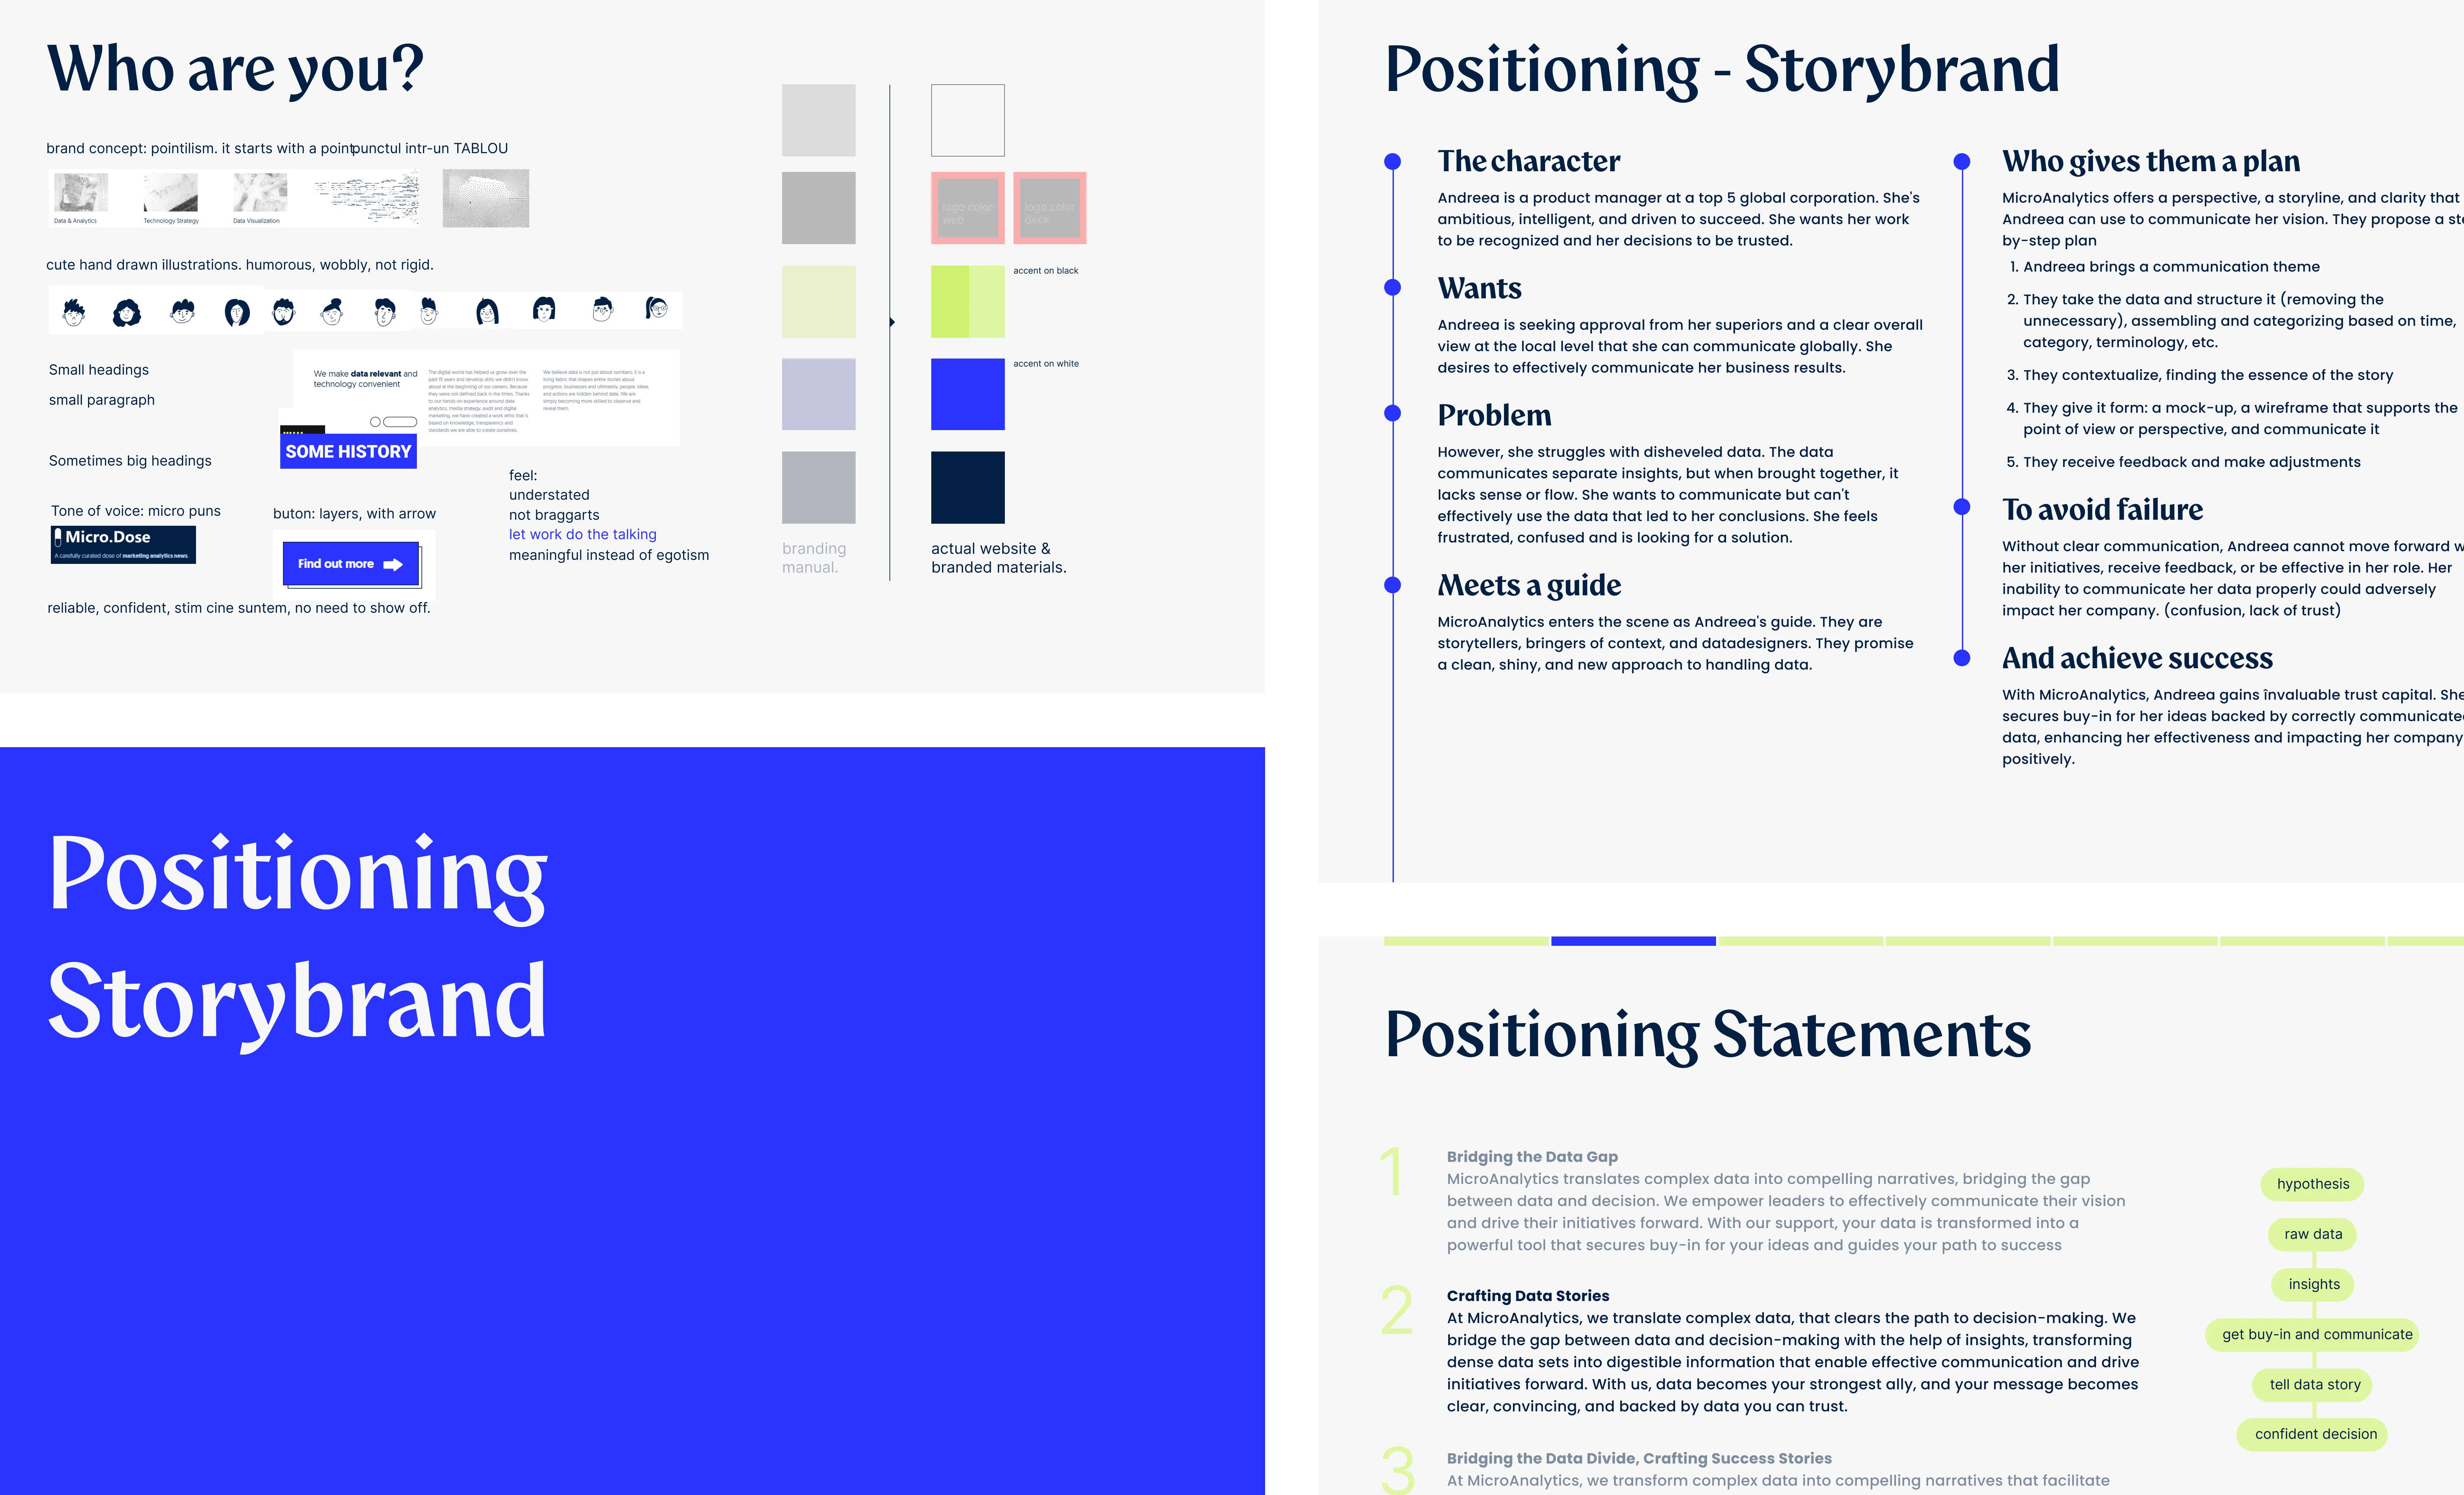
The Pointillism illustration system
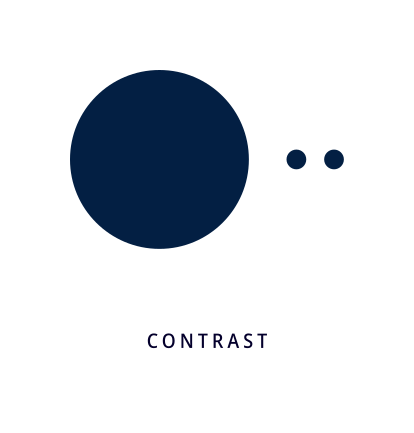
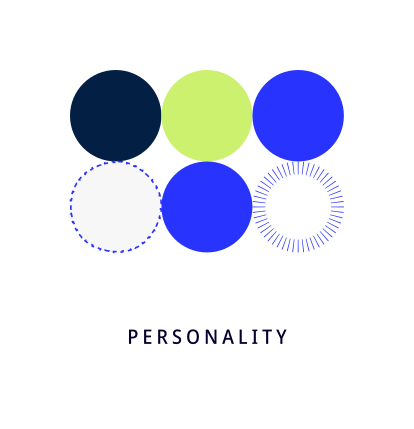
The visual language we developed treats data as something alive. Dots and circles that drift, cluster, overlap, and land with intention. Minimalist modernism with sparkly personality. A system rigorous enough to scale, loose enough to expand into something novel.
Story made reality - brand vocabulary, from concept to application.


From a Google Doc to a Webflow site
The landing page content was, as always, a long Google doc filled with useful information. The marketing team had done a great job of pruning it to the essentials. But sometimes that is not enough. Sometimes, when the content is longer but worth it you employ the ol’ faithful tools: design, storytelling and animation.
Animation + storytelling: the heavy lifters
As Microanalytics were in the data visualization business, it was only natural that animation would have to play a big part of the design. But how?
Animation is wonderful, in that it can do a lot of the heavy lifting for a project. Instead of scrolling many static images you can just animate them to great effect. The human brain is built to respond to motion. On the landing page we used it to explain the services and benefits, supported the content with demonstrations, translated some of the more obscure concepts, and infused them with personality.
Long form content with low cognitive load
Better than animation is animation you get to control and get interact with at your own pace. That’s why we make use of scrollytelling. Compared to traditional animation, it’s a form of interactive content that is web native. We used Webflow to bring it to life.
Better even than animation you get to control is animation that is fast, smooth, and lightweight. That is why we use Rive or Lottie.
Motion does what text simply cannot: it doesn't tell you how something works, it makes you feel it work. Writing "we turn data into stories" is one thing. Watching it happen in front of you is another thing entirely.
Data visualization is a service you can describe in a paragraph or demonstrate in four seconds of scroll. We chose four seconds.
On accessibility and performance
The most engaging scrollytelling experience in the world doesn't matter if the page takes four seconds to load, if half your audience can't navigate it, or if the algorithm buries it due to inaccessibility. We take accessibility seriously and try to strike a balance between form and function.
These are the scores obtained when analyzed by Google’s Lighthouse, and Webflow plays a huge part in these results.

Outcomes
We simplified and worked on the consistency of the visual identity and it was in a great state to propagate throughout the rest of the website, having considered the whole range of the services.
The content of the landing was long and abstract, so we made use of animation in three ways to reduce cognitive load, hold the audience engaged, and explain abstract concepts, while providing a consistent experience.
Lastly we built it in Webflow and Lottie. Webflow is a powerful platform that powers many websites, and is known to be a solid base of operations that help with visibility and SEO.
